Regressão quantílica para produção de Teca
Walmes M. Zeviani & Milson E. Serafim
Source:vignettes/teca_quantilica.Rmd
teca_quantilica.RmdPrepara a tabela de dados
# glimpse(teca_arv)
# glimpse(teca_qui)
# glimpse(teca_crapar)
# glimpse(teca_gran)

# Junções.
tb <- full_join(teca_qui, teca_crapar)
## Joining, by = c("loc", "cam")tb <- inner_join(tb, teca_arv[, c("loc", "prod")])## Joining, by = "loc"tb <- as_tibble(tb)
glimpse(tb)## Observations: 150
## Variables: 24
## $ loc <int> 1, 1, 1, 2, 2, 2, 3, 3, 3, 4, 4, 4, 5, 5, 5, 6, 6, 6…
## $ cam <fct> "[0, 5)", "[5, 40)", "[40, 80)", "[0, 5)", "[5, 40)"…
## $ ph <dbl> 6.8, 6.7, 6.7, 4.7, 4.7, 4.9, 7.6, 6.8, 6.9, 6.6, 6.…
## $ p <dbl> 22.51, 0.83, 0.01, 3.89, 0.69, 0.10, 11.52, 1.66, 0.…
## $ k <dbl> 72.24, 13.42, 7.23, 48.13, 12.34, 8.64, 114.55, 25.8…
## $ ca <dbl> 8.27, 2.91, 2.33, 0.97, 0.76, 0.21, 7.63, 3.22, 2.22…
## $ mg <dbl> 1.70, 1.77, 0.51, 0.16, 0.14, 0.00, 1.53, 1.31, 1.09…
## $ al <dbl> 0.0, 0.0, 0.0, 0.3, 0.6, 0.6, 0.0, 0.0, 0.0, 0.0, 0.…
## $ ctc <dbl> 12.47, 6.57, 4.52, 5.30, 4.17, 3.47, 12.41, 6.26, 5.…
## $ sat <dbl> 81.41, 71.74, 63.23, 23.66, 22.35, 6.69, 76.14, 73.4…
## $ mo <dbl> 72.2, 25.6, 9.7, 34.4, 8.7, 9.7, 50.4, 15.6, 9.5, 50…
## $ arg <dbl> 183.7, 215.0, 285.5, 231.9, 212.6, 237.0, 192.6, 234…
## $ are <dbl> 769.5, 749.5, 674.5, 741.0, 775.0, 752.0, 715.5, 698…
## $ cas <dbl> 1.8, 2.2, 3.7, 0.4, 1.1, 1.7, 8.4, 19.0, 14.3, 5.5, …
## $ acc <dbl> 769.93, 750.04, 675.69, 741.11, 775.25, 752.42, 717.…
## $ Ur <dbl> 0.22288275, 0.17845472, 0.18791987, 0.13107692, 0.16…
## $ Us <dbl> 0.6477212, 0.5799842, 0.6472682, 0.6967997, 0.572831…
## $ alp <dbl> -0.7242483, -0.8327602, -0.7221707, -0.5484938, -0.5…
## $ n <dbl> 3.589612, 3.112403, 3.250733, 4.006821, 2.917137, 2.…
## $ I <dbl> 0.8152153, 0.9572842, 0.8352604, 0.6201503, 0.690926…
## $ Ui <dbl> 0.4497358, 0.3956184, 0.4353160, 0.4306964, 0.387045…
## $ S <dbl> -0.34126593, -0.27326860, -0.32901803, -0.51467615, …
## $ cad <dbl> 0.2268530, 0.2171637, 0.2473961, 0.2996195, 0.222109…
## $ prod <dbl> 68.22631, 68.22631, 68.22631, 24.27449, 24.27449, 24…# Trata valor alto de P.
tb$p[tb$p > 80] <- NA
# Empilha os valores das variáveis de solo.
tb_long <- tb %>%
gather(key = "variable", value = "valor", ph:cad)# Protótipo.
gg <- ggplot(data = tb_long,
mapping = aes(x = valor, y = prod, color = cam)) +
facet_wrap(facets = ~variable, scales = "free_x", ncol = 3) +
geom_point(shape = 1) +
labs(color = "Camada") +
xlab("Valor da variável de solo") +
ylab("Produção de teca")
# Regressão linear simples.
gg +
geom_smooth(method = "lm",
formula = y ~ poly(x, degree = 2),
se = FALSE)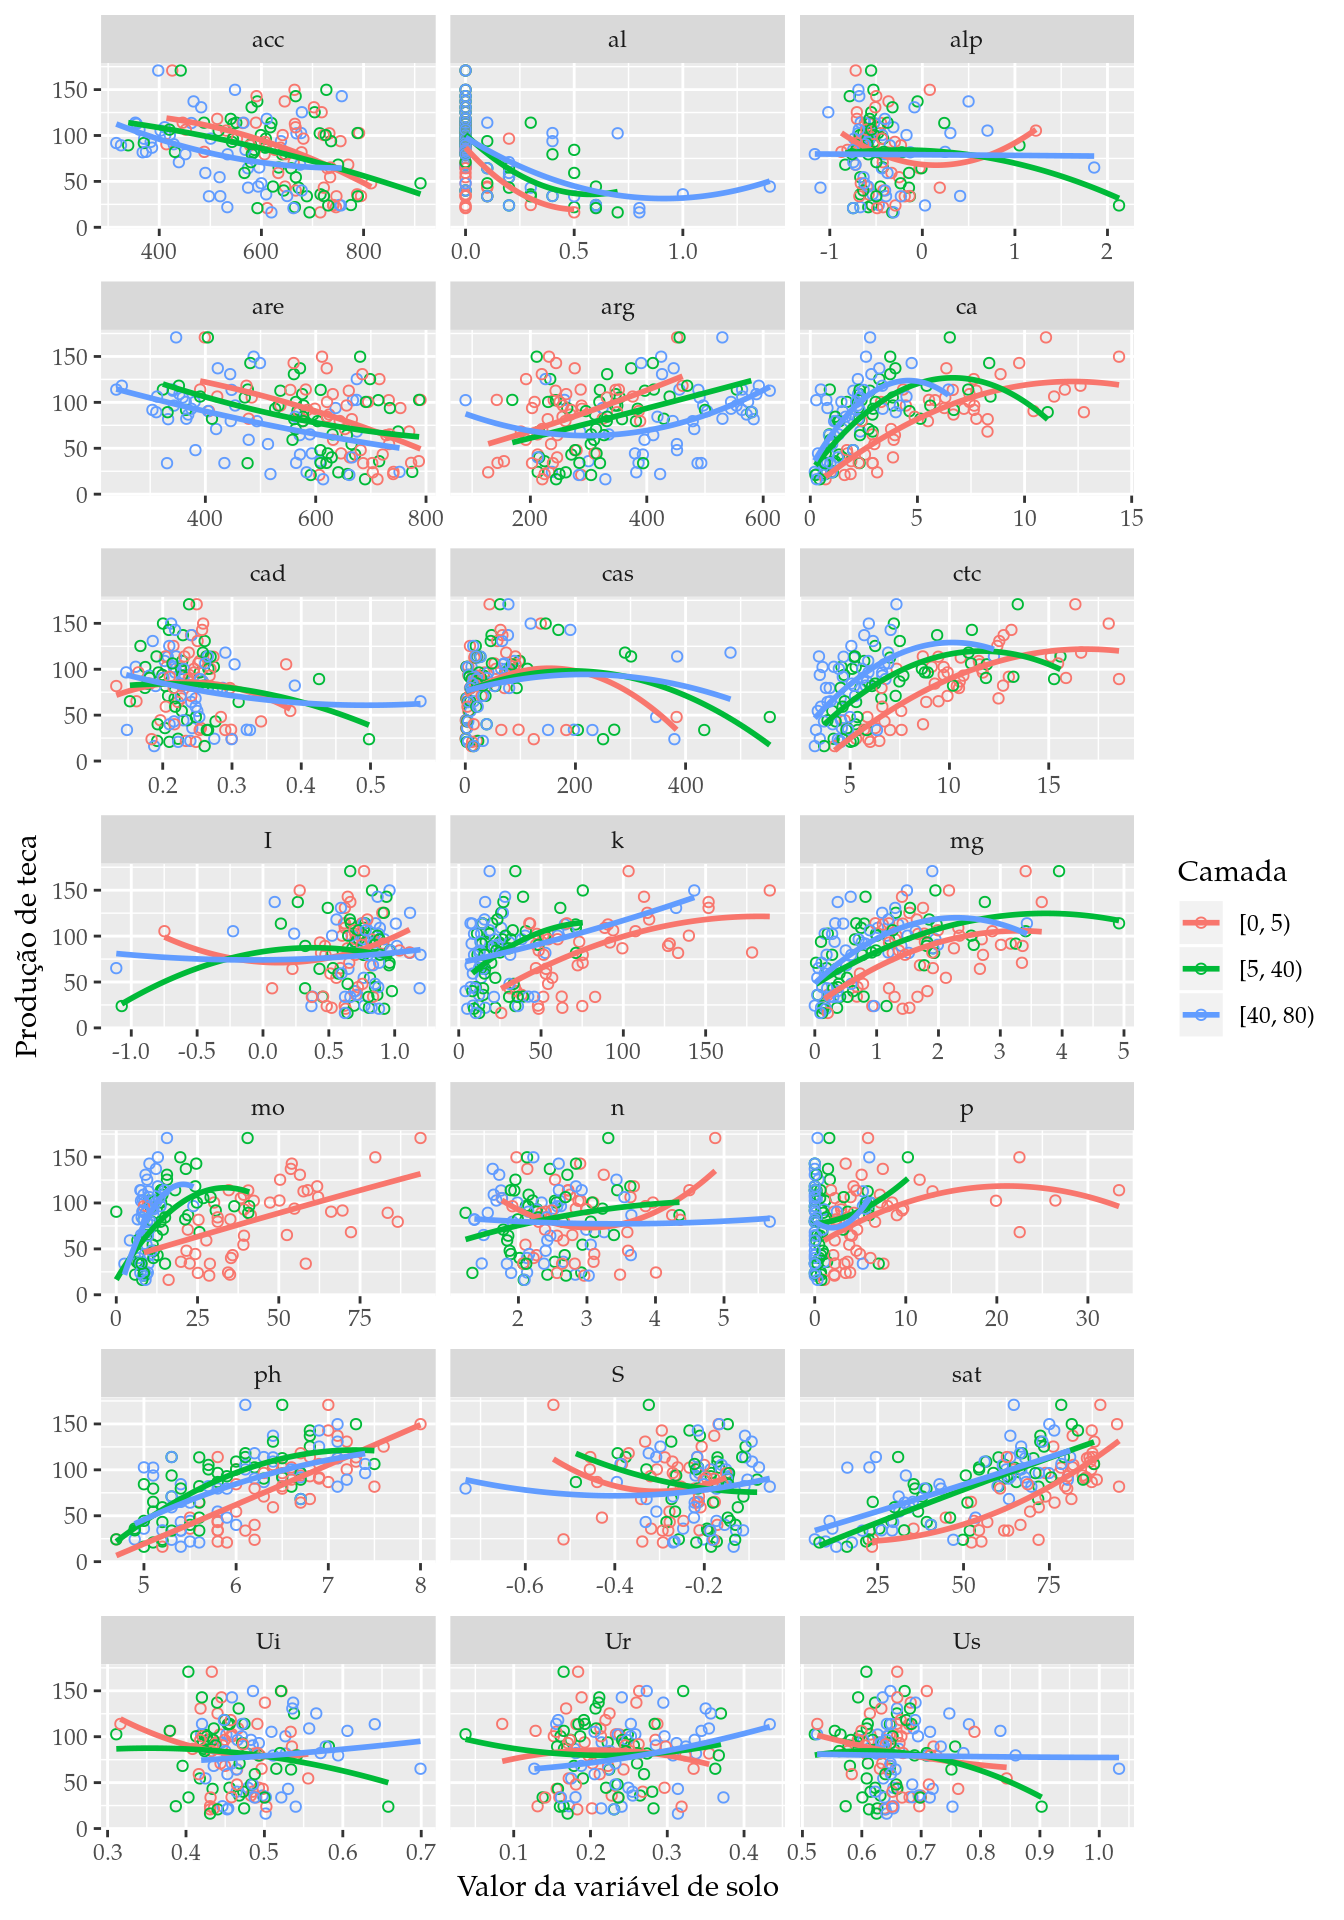
# Regressão quantílica.
gg +
    geom_quantile(quantiles = 0.9,
                  formula = y ~ poly(x, degree = 2))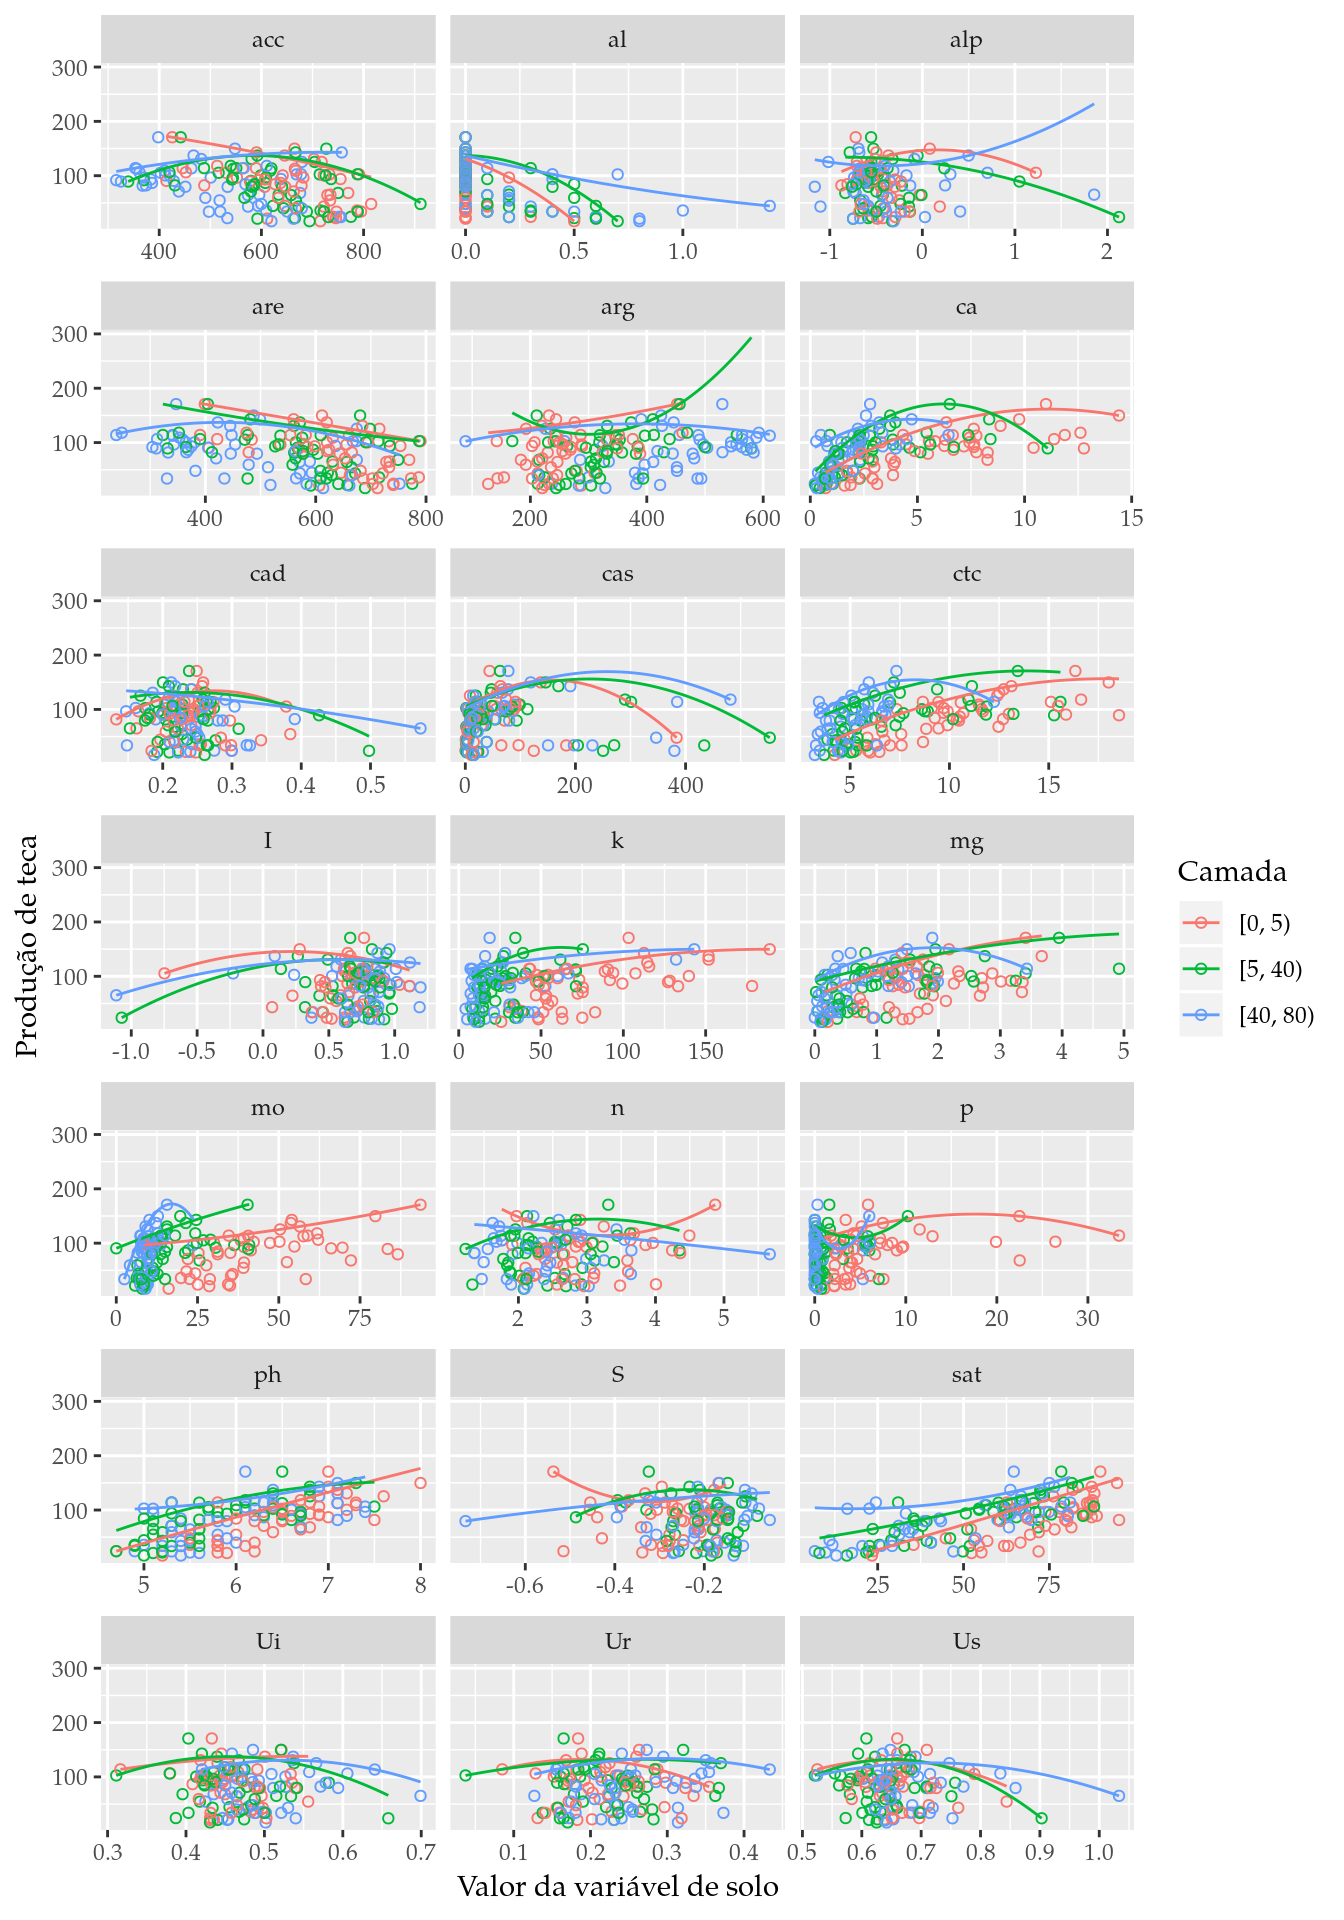
Regressão quantílica
tb_fit <- tb_long %>%
    group_by(variable, cam) %>%
    drop_na() %>%
    nest()

# ATTENTION: o modelo 0 é reajustado em função dos missings que mudam de
# quantidade como função do split.
tb_fit <- tb_fit %>%
    mutate(qtl_0 = map(data,
                       rq,
                       formula = prod ~ 1,
                       tau = 0.9),
           qtl_1 = map(data,
                       rq,
                       formula = prod ~ valor,
                       tau = 0.9),
           qtl_2 = map(data,
                       rq,
                       formula = prod ~ valor + I(valor^2),
                       tau = 0.9))

# # Quadro de anova para modelos encaixados.
# tb_fit <- tb_fit %>%
#     mutate(anova_01 = map(qtl_1, anova, qtl_0),
#            anova_12 = map2(qtl_2, qtl_1, anova))
extract_coef <- function(fit_work, fit_ref) {
    if (missing(fit_ref)) {
        p <- NULL
    } else {
        p <- anova(fit_work, fit_ref)$table$pvalue
    }
    b <- coef(fit_work)
    c(b, pvalue = p) %>%
        as.list() %>%
        data.frame(check.names = FALSE)
}

# # Teste.
# extract_coef(tb_fit$qtl_2[[1]], tb_fit$qtl_1[[1]])
# extract_coef(tb_fit$qtl_1[[1]], qtl_0)

# Extrai as estimativas e valor p para criar tabela.
tb_result <- tb_fit %>%
    transmute(variable = variable,
              cam = cam,
              null = map(qtl_0, extract_coef),
              first = map2(qtl_1, qtl_0, extract_coef),
              secon = map2(qtl_2, qtl_1, extract_coef),
              ) %>%
    gather("model", "coef", -variable, -cam) %>%
    unnest(coef)
tb_result
## # A tibble: 189 x 7
## variable cam model `(Intercept)` valor pvalue `I(valor^2)`
## <chr> <fct> <chr> <dbl> <dbl> <dbl> <dbl>
## 1 ph [0, 5) null 125. NA NA NA
## 2 ph [5, 40) null 125. NA NA NA
## 3 ph [40, 80) null 125. NA NA NA
## 4 p [0, 5) null 131. NA NA NA
## 5 p [5, 40) null 125. NA NA NA
## 6 p [40, 80) null 125. NA NA NA
## 7 k [0, 5) null 125. NA NA NA
## 8 k [5, 40) null 125. NA NA NA
## 9 k [40, 80) null 125. NA NA NA
## 10 ca [0, 5) null 125. NA NA NA
## # … with 179 more rows# Organiza para melhor disposição da informação.
tb_result <- tb_result %>%
rename(beta_0 = "(Intercept)",
beta_1 = "valor",
beta_2 = "I(valor^2)") %>%
select(-pvalue, everything()) %>%
mutate(model = factor(model, levels = unique(model))) %>%
arrange(variable, cam, model)
tb_result## # A tibble: 189 x 7
## variable cam model beta_0 beta_1 beta_2 pvalue
## <chr> <fct> <fct> <dbl> <dbl> <dbl> <dbl>
## 1 acc [0, 5) null 125. NA NA NA
## 2 acc [0, 5) first 243. -0.169 NA 0.0870
## 3 acc [0, 5) secon 222. -0.0836 -0.0000844 0.906
## 4 acc [5, 40) null 125. NA NA NA
## 5 acc [5, 40) first 156. -0.0437 NA 0.654
## 6 acc [5, 40) secon -137. 0.940 -0.000806 0.474
## 7 acc [40, 80) null 125. NA NA NA
## 8 acc [40, 80) first 88.7 0.0715 NA 0.391
## 9 acc [40, 80) secon 31.6 0.309 -0.000213 0.646
## 10 al [0, 5) null 125. NA NA NA
## # … with 179 more rows# Ajustes significativos a 5%. Pega o maior modelo.
tb_signif <- tb_result %>%
filter(pvalue < 0.05) %>%
group_by(variable, cam) %>%
slice(n()) %>%
ungroup()
knitr::kable(tb_result)| variable | cam | model | beta_0 | beta_1 | beta_2 | pvalue |
|---|---|---|---|---|---|---|
| acc | [0, 5) | null | 125.3399596 | NA | NA | NA |
| acc | [0, 5) | first | 242.7814910 | -0.1692722 | NA | 0.0869799 |
| acc | [0, 5) | secon | 221.5909382 | -0.0835741 | -0.0000844 | 0.9057883 |
| acc | [5, 40) | null | 125.3399596 | NA | NA | NA |
| acc | [5, 40) | first | 156.0849914 | -0.0436577 | NA | 0.6544456 |
| acc | [5, 40) | secon | -136.6867935 | 0.9395528 | -0.0008058 | 0.4744945 |
| acc | [40, 80) | null | 125.3399596 | NA | NA | NA |
| acc | [40, 80) | first | 88.6954207 | 0.0715023 | NA | 0.3910965 |
| acc | [40, 80) | secon | 31.5983069 | 0.3085285 | -0.0002134 | 0.6455436 |
| al | [0, 5) | null | 125.3399596 | NA | NA | NA |
| al | [0, 5) | first | 130.7281877 | -170.7276572 | NA | 0.3814584 |
| al | [0, 5) | secon | 130.7281877 | -131.9440885 | -193.9178436 | 1.0000000 |
| al | [5, 40) | null | 125.3399596 | NA | NA | NA |
| al | [5, 40) | first | 137.1213808 | -105.5689730 | NA | 0.0018894 |
| al | [5, 40) | secon | 137.1213808 | -5.6605508 | -238.5353322 | 0.2474453 |
| al | [40, 80) | null | 125.3399596 | NA | NA | NA |
| al | [40, 80) | first | 137.1213808 | -66.2268338 | NA | 0.0292740 |
| al | [40, 80) | secon | 137.1213808 | -94.0916949 | 19.9034722 | 0.5553745 |
| alp | [0, 5) | null | 130.7281877 | NA | NA | NA |
| alp | [0, 5) | first | 147.2570076 | 30.9784959 | NA | 0.0595835 |
| alp | [0, 5) | secon | 146.5564189 | 12.1585501 | -37.3017227 | 0.8361981 |
| alp | [5, 40) | null | 130.7281877 | NA | NA | NA |
| alp | [5, 40) | first | 120.3809779 | -28.6306365 | NA | 0.0015285 |
| alp | [5, 40) | secon | 125.2197392 | -21.1110934 | -12.5222173 | 0.5404658 |
| alp | [40, 80) | null | 125.3399596 | NA | NA | NA |
| alp | [40, 80) | first | 131.2219618 | 5.7890335 | NA | 0.6608027 |
| alp | [40, 80) | secon | 122.2283874 | 18.9924755 | 21.7062767 | 0.6458951 |
| are | [0, 5) | null | 125.3399596 | NA | NA | NA |
| are | [0, 5) | first | 239.9696595 | -0.1734461 | NA | 0.0510935 |
| are | [0, 5) | secon | 239.2790786 | -0.1704822 | -0.0000031 | 0.9936331 |
| are | [5, 40) | null | 125.3399596 | NA | NA | NA |
| are | [5, 40) | first | 206.0493722 | -0.1312763 | NA | 0.1886225 |
| are | [5, 40) | secon | 242.8573946 | -0.2544612 | 0.0000971 | 0.9132254 |
| are | [40, 80) | null | 125.3399596 | NA | NA | NA |
| are | [40, 80) | first | 141.1759500 | -0.0234781 | NA | 0.7269071 |
| are | [40, 80) | secon | 30.1449448 | 0.4977881 | -0.0005789 | 0.2911675 |
| arg | [0, 5) | null | 125.3399596 | NA | NA | NA |
| arg | [0, 5) | first | 84.2943767 | 0.1912636 | NA | 0.1872307 |
| arg | [0, 5) | secon | 108.5165147 | 0.0499888 | 0.0001940 | 0.7759759 |
| arg | [5, 40) | null | 125.3399596 | NA | NA | NA |
| arg | [5, 40) | first | 79.5199105 | 0.1542883 | NA | 0.2610368 |
| arg | [5, 40) | secon | 322.2366116 | -1.3774678 | 0.0022913 | 0.1331249 |
| arg | [40, 80) | null | 125.3399596 | NA | NA | NA |
| arg | [40, 80) | first | 119.2573446 | 0.0269142 | NA | 0.5051287 |
| arg | [40, 80) | secon | 80.1683848 | 0.2836520 | -0.0003707 | 0.4020180 |
| ca | [0, 5) | null | 125.3399596 | NA | NA | NA |
| ca | [0, 5) | first | 58.6995879 | 8.7339937 | NA | 0.0000799 |
| ca | [0, 5) | secon | 28.2771531 | 24.0039433 | -1.0808063 | 0.0338630 |
| ca | [5, 40) | null | 125.3399596 | NA | NA | NA |
| ca | [5, 40) | first | 80.8817553 | 13.8068958 | NA | 0.0000000 |
| ca | [5, 40) | secon | 36.8470351 | 43.1311267 | -3.4654478 | 0.0219065 |
| ca | [40, 80) | null | 125.3399596 | NA | NA | NA |
| ca | [40, 80) | first | 99.0822352 | 11.8133993 | NA | 0.1967138 |
| ca | [40, 80) | secon | 86.0424446 | 24.0838810 | -2.5530613 | 0.7871121 |
| cad | [0, 5) | null | 130.7281877 | NA | NA | NA |
| cad | [0, 5) | first | 16.1061292 | 493.4425225 | NA | 0.1607618 |
| cad | [0, 5) | secon | -64.6981709 | 1454.5346898 | -2657.1934029 | 0.7374688 |
| cad | [5, 40) | null | 130.7281877 | NA | NA | NA |
| cad | [5, 40) | first | 192.8750229 | -243.3021733 | NA | 0.4836707 |
| cad | [5, 40) | secon | 63.1877896 | 571.4228015 | -1198.2065064 | 0.6985334 |
| cad | [40, 80) | null | 125.3399596 | NA | NA | NA |
| cad | [40, 80) | first | 162.2219522 | -169.7106073 | NA | 0.4153979 |
| cad | [40, 80) | secon | 143.6439165 | -37.1307391 | -174.9621651 | 0.9907049 |
| cas | [0, 5) | null | 125.3399596 | NA | NA | NA |
| cas | [0, 5) | first | 106.7252288 | 0.4131318 | NA | 0.3717260 |
| cas | [0, 5) | secon | 102.6018363 | 0.6523066 | -0.0020711 | 0.9608153 |
| cas | [5, 40) | null | 125.3399596 | NA | NA | NA |
| cas | [5, 40) | first | 123.1233110 | 0.1166657 | NA | 0.3657985 |
| cas | [5, 40) | secon | 105.0956672 | 0.4527831 | -0.0010058 | 0.0812513 |
| cas | [40, 80) | null | 125.3399596 | NA | NA | NA |
| cas | [40, 80) | first | 123.9213204 | 0.0992055 | NA | 0.7843676 |
| cas | [40, 80) | secon | 101.3922279 | 0.5292657 | -0.0010270 | 0.0736023 |
| ctc | [0, 5) | null | 125.3399596 | NA | NA | NA |
| ctc | [0, 5) | first | 18.1834217 | 9.3431233 | NA | 0.0000000 |
| ctc | [0, 5) | secon | -35.5895227 | 21.4547573 | -0.5987012 | 0.1064256 |
| ctc | [5, 40) | null | 125.3399596 | NA | NA | NA |
| ctc | [5, 40) | first | 77.3971759 | 6.9469844 | NA | 0.0755217 |
| ctc | [5, 40) | secon | 19.3268654 | 21.8761331 | -0.7893185 | 0.1702872 |
| ctc | [40, 80) | null | 125.3399596 | NA | NA | NA |
| ctc | [40, 80) | first | 33.6261271 | 18.1252633 | NA | 0.0000055 |
| ctc | [40, 80) | secon | -24.9270705 | 43.2765769 | -2.6088990 | 0.4969509 |
| I | [0, 5) | null | 130.7281877 | NA | NA | NA |
| I | [0, 5) | first | 142.5518578 | -19.0085912 | NA | 0.0346537 |
| I | [0, 5) | secon | 143.5441724 | 18.8677215 | -43.0403917 | 0.9555452 |
| I | [5, 40) | null | 130.7281877 | NA | NA | NA |
| I | [5, 40) | first | 136.9520601 | -12.6513906 | NA | 0.8787615 |
| I | [5, 40) | secon | 118.5823132 | 44.7030139 | -40.6825566 | 0.9852954 |
| I | [40, 80) | null | 125.3399596 | NA | NA | NA |
| I | [40, 80) | first | 136.8050670 | -10.2689290 | NA | 0.5068023 |
| I | [40, 80) | secon | 122.3674928 | 27.0594748 | -21.8517283 | 0.8107026 |
| k | [0, 5) | null | 125.3399596 | NA | NA | NA |
| k | [0, 5) | first | 94.8403859 | 0.2905706 | NA | 0.3161960 |
| k | [0, 5) | secon | 64.7081240 | 0.9089478 | -0.0024286 | 0.5565028 |
| k | [5, 40) | null | 125.3399596 | NA | NA | NA |
| k | [5, 40) | first | 98.6329934 | 1.0351537 | NA | 0.1853189 |
| k | [5, 40) | secon | 78.3275639 | 2.4080313 | -0.0193771 | 0.2078543 |
| k | [40, 80) | null | 125.3399596 | NA | NA | NA |
| k | [40, 80) | first | 114.2123355 | 0.2483351 | NA | 0.2088884 |
| k | [40, 80) | secon | 110.2704307 | 0.5279234 | -0.0017614 | 0.9900008 |
| mg | [0, 5) | null | 125.3399596 | NA | NA | NA |
| mg | [0, 5) | first | 88.3719963 | 24.1620676 | NA | 0.0056628 |
| mg | [0, 5) | secon | 63.7110559 | 47.5122765 | -4.7267629 | 0.3424041 |
| mg | [5, 40) | null | 125.3399596 | NA | NA | NA |
| mg | [5, 40) | first | 98.3412154 | 20.6097284 | NA | 0.0000000 |
| mg | [5, 40) | secon | 90.7965741 | 30.5876948 | -2.6183831 | 0.4430848 |
| mg | [40, 80) | null | 125.3399596 | NA | NA | NA |
| mg | [40, 80) | first | 97.4437881 | 35.1025581 | NA | 0.0094896 |
| mg | [40, 80) | secon | 93.0788384 | 62.5756826 | -16.4722335 | 0.0127413 |
| mo | [0, 5) | null | 125.3399596 | NA | NA | NA |
| mo | [0, 5) | first | 80.6395689 | 0.9628748 | NA | 0.0000026 |
| mo | [0, 5) | secon | 92.4213577 | 0.4386504 | 0.0042559 | 0.4313433 |
| mo | [5, 40) | null | 125.3399596 | NA | NA | NA |
| mo | [5, 40) | first | 90.4940904 | 2.1278751 | NA | 0.0028011 |
| mo | [5, 40) | secon | 90.4940904 | 2.3889639 | -0.0099522 | 0.7652067 |
| mo | [40, 80) | null | 125.3399596 | NA | NA | NA |
| mo | [40, 80) | first | 54.5965946 | 7.4466700 | NA | 0.0002254 |
| mo | [40, 80) | secon | -17.6631983 | 22.2022824 | -0.6489471 | 0.0135526 |
| n | [0, 5) | null | 130.7281877 | NA | NA | NA |
| n | [0, 5) | first | 106.1275835 | 7.5803934 | NA | 0.5878307 |
| n | [0, 5) | secon | 343.5861245 | -141.0437397 | 21.6700783 | 0.0657778 |
| n | [5, 40) | null | 130.7281877 | NA | NA | NA |
| n | [5, 40) | first | 56.6455414 | 30.3521323 | NA | 0.0968684 |
| n | [5, 40) | secon | -3.1554711 | 93.4554648 | -14.8056498 | 0.1981882 |
| n | [40, 80) | null | 125.3399596 | NA | NA | NA |
| n | [40, 80) | first | 150.1322667 | -11.2830135 | NA | 0.4630350 |
| n | [40, 80) | secon | 147.2798058 | -8.6197431 | -0.5841696 | 0.9905613 |
| p | [0, 5) | null | 130.7281877 | NA | NA | NA |
| p | [0, 5) | first | 110.8585205 | 1.7298968 | NA | 0.0498837 |
| p | [0, 5) | secon | 104.1407964 | 5.5962157 | -0.1586961 | 0.7864525 |
| p | [5, 40) | null | 125.3399596 | NA | NA | NA |
| p | [5, 40) | first | 120.6124191 | 2.8479160 | NA | 0.5378798 |
| p | [5, 40) | secon | 132.7182502 | -10.1819150 | 1.1580122 | 0.4553431 |
| p | [40, 80) | null | 125.3399596 | NA | NA | NA |
| p | [40, 80) | first | 123.5466402 | 4.3739498 | NA | 0.3679250 |
| p | [40, 80) | secon | 131.0294212 | -30.1789505 | 5.5598812 | 0.6625321 |
| ph | [0, 5) | null | 125.3399596 | NA | NA | NA |
| ph | [0, 5) | first | -185.2818359 | 45.4089038 | NA | 0.0038973 |
| ph | [0, 5) | secon | -228.3331060 | 58.1992239 | -0.9474311 | 0.9650765 |
| ph | [5, 40) | null | 125.3399596 | NA | NA | NA |
| ph | [5, 40) | first | -78.1712241 | 32.5016237 | NA | 0.0097559 |
| ph | [5, 40) | secon | -419.2027386 | 146.7780169 | -9.4301029 | 0.4019841 |
| ph | [40, 80) | null | 125.3399596 | NA | NA | NA |
| ph | [40, 80) | first | -3.0427377 | 21.1423992 | NA | 0.2350978 |
| ph | [40, 80) | secon | 216.9607180 | -54.7428507 | 6.3769118 | 0.7749197 |
| S | [0, 5) | null | 130.7281877 | NA | NA | NA |
| S | [0, 5) | first | 97.1033864 | -137.1148424 | NA | 0.1934667 |
| S | [0, 5) | secon | 230.1793191 | 727.4623888 | 1148.2501243 | 0.0526720 |
| S | [5, 40) | null | 130.7281877 | NA | NA | NA |
| S | [5, 40) | first | 112.8938051 | -115.4770425 | NA | 0.4502783 |
| S | [5, 40) | secon | 95.5808004 | -358.6291512 | -765.6294102 | 0.7286439 |
| S | [40, 80) | null | 125.3399596 | NA | NA | NA |
| S | [40, 80) | first | 135.8980053 | 54.9045455 | NA | 0.6150499 |
| S | [40, 80) | secon | 134.0359725 | 29.3864320 | -60.9911750 | 0.9831038 |
| sat | [0, 5) | null | 125.3399596 | NA | NA | NA |
| sat | [0, 5) | first | -19.7848062 | 1.8621851 | NA | 0.0000014 |
| sat | [0, 5) | secon | -19.2717225 | 1.8346242 | 0.0002483 | 0.9962725 |
| sat | [5, 40) | null | 125.3399596 | NA | NA | NA |
| sat | [5, 40) | first | 30.7137363 | 1.4601676 | NA | 0.0021402 |
| sat | [5, 40) | secon | 40.8642741 | 0.9048139 | 0.0052851 | 0.8377722 |
| sat | [40, 80) | null | 125.3399596 | NA | NA | NA |
| sat | [40, 80) | first | 83.7054805 | 0.8394767 | NA | 0.1031402 |
| sat | [40, 80) | secon | 106.9974701 | -0.5201477 | 0.0145440 | 0.6106124 |
| Ui | [0, 5) | null | 130.7281877 | NA | NA | NA |
| Ui | [0, 5) | first | 74.0904730 | 125.8978534 | NA | 0.6683206 |
| Ui | [0, 5) | secon | -0.3864461 | 510.0777980 | -470.2272890 | 0.7771003 |
| Ui | [5, 40) | null | 130.7281877 | NA | NA | NA |
| Ui | [5, 40) | first | 189.9649650 | -120.1787644 | NA | 0.5702511 |
| Ui | [5, 40) | secon | -214.8193626 | 1553.1463106 | -1711.9311693 | 0.8092556 |
| Ui | [40, 80) | null | 125.3399596 | NA | NA | NA |
| Ui | [40, 80) | first | 90.5095782 | 61.5251262 | NA | 0.7255424 |
| Ui | [40, 80) | secon | -263.1545532 | 1486.3876744 | -1402.1356242 | 0.3999665 |
| Ur | [0, 5) | null | 130.7281877 | NA | NA | NA |
| Ur | [0, 5) | first | 146.7536272 | -95.2672771 | NA | 0.5950321 |
| Ur | [0, 5) | secon | 70.5667213 | 660.7814220 | -1775.0689420 | 0.2109792 |
| Ur | [5, 40) | null | 130.7281877 | NA | NA | NA |
| Ur | [5, 40) | first | 96.4979559 | 165.7179692 | NA | 0.2342710 |
| Ur | [5, 40) | secon | 91.9034604 | 311.3371599 | -597.2970319 | 0.8605253 |
| Ur | [40, 80) | null | 125.3399596 | NA | NA | NA |
| Ur | [40, 80) | first | 100.5071318 | 86.3463986 | NA | 0.5660589 |
| Ur | [40, 80) | secon | 43.5272675 | 615.9799131 | -1048.1004065 | 0.5375682 |
| Us | [0, 5) | null | 130.7281877 | NA | NA | NA |
| Us | [0, 5) | first | 36.5036707 | 147.4547824 | NA | 0.1931430 |
| Us | [0, 5) | secon | -366.7180069 | 1545.6595871 | -1200.3176207 | 0.7455504 |
| Us | [5, 40) | null | 130.7281877 | NA | NA | NA |
| Us | [5, 40) | first | 261.8051853 | -200.3486456 | NA | 0.1899799 |
| Us | [5, 40) | secon | -598.5709640 | 2242.0511630 | -1719.6932484 | 0.8029661 |
| Us | [40, 80) | null | 125.3399596 | NA | NA | NA |
| Us | [40, 80) | first | 222.9996526 | -139.9538365 | NA | 0.4909162 |
| Us | [40, 80) | secon | -191.6242472 | 883.2021409 | -614.2777354 | 0.7484711 |
knitr::kable(tb_signif)| variable | cam | model | beta_0 | beta_1 | beta_2 | pvalue |
|---|---|---|---|---|---|---|
| al | [5, 40) | first | 137.12138 | -105.5689730 | NA | 0.0018894 |
| al | [40, 80) | first | 137.12138 | -66.2268338 | NA | 0.0292740 |
| alp | [5, 40) | first | 120.38098 | -28.6306365 | NA | 0.0015285 |
| ca | [0, 5) | secon | 28.27715 | 24.0039433 | -1.0808063 | 0.0338630 |
| ca | [5, 40) | secon | 36.84704 | 43.1311267 | -3.4654478 | 0.0219065 |
| ctc | [0, 5) | first | 18.18342 | 9.3431233 | NA | 0.0000000 |
| ctc | [40, 80) | first | 33.62613 | 18.1252633 | NA | 0.0000055 |
| I | [0, 5) | first | 142.55186 | -19.0085912 | NA | 0.0346537 |
| mg | [0, 5) | first | 88.37200 | 24.1620676 | NA | 0.0056628 |
| mg | [5, 40) | first | 98.34122 | 20.6097284 | NA | 0.0000000 |
| mg | [40, 80) | secon | 93.07884 | 62.5756826 | -16.4722335 | 0.0127413 |
| mo | [0, 5) | first | 80.63957 | 0.9628748 | NA | 0.0000026 |
| mo | [5, 40) | first | 90.49409 | 2.1278751 | NA | 0.0028011 |
| mo | [40, 80) | secon | -17.66320 | 22.2022824 | -0.6489471 | 0.0135526 |
| p | [0, 5) | first | 110.85852 | 1.7298968 | NA | 0.0498837 |
| ph | [0, 5) | first | -185.28184 | 45.4089038 | NA | 0.0038973 |
| ph | [5, 40) | first | -78.17122 | 32.5016237 | NA | 0.0097559 |
| sat | [0, 5) | first | -19.78481 | 1.8621851 | NA | 0.0000014 |
| sat | [5, 40) | first | 30.71374 | 1.4601676 | NA | 0.0021402 |
# Limites de recomendação.

# Torância: 10% abaixo da maior produção observada.
tol <- max(teca_arv$prod) - max(teca_arv$prod) * 0.9

quantile_limits <- function(beta_0, beta_1, beta_2, tol, x_range) {
    coefs <- c(c = beta_0, b = beta_1, a = beta_2)
    # ex <- extendrange(x_range)
    ex <- x_range
    x_seq <- seq(ex[1], ex[2], length.out = 51)
    if (is.finite(beta_2)) {
        # Modelo de segundo grau.
        x_opt <- -beta_1/(2 * beta_2)
        y_opt <- c(x_opt^(0:2) %*% coefs)
        roots <- with(as.list(coefs), {
            delta <- sqrt(b^2 - 4 * a * (c - y_opt + tol))
            suppressWarnings({
                (-b + c(-1, 1) * delta)/(2 * a)
            })
        })
        limits <- data.frame(y_opt = y_opt,
                             x_opt = x_opt,
                             y_tol = y_opt - tol,
                             x_tol_inf = min(roots),
                             x_tol_sup = max(roots))
        pred <- data.frame(x = x_seq,
                           y = beta_0 + beta_1 * x_seq + beta_2 * x_seq^2)
        return(list(limits, pred))
    } else if (is.finite(beta_1)) {
        # Modelo de primeiro grau.
        y_range <- beta_0 + beta_1 * x_range
        x_opt <- x_range[which.max(y_range)]
        y_opt <- max(y_range)
        x_tol <- x_opt - tol/beta_1
        limits <- data.frame(y_opt = y_opt,
                             x_opt = x_opt,
                             y_tol = y_opt - tol,
                             x_tol_inf = ifelse(x_tol < x_opt, x_tol, NA),
                             x_tol_sup = ifelse(x_tol > x_opt, x_tol, NA))
        pred <- data.frame(x = x_seq,
                           y = beta_0 + beta_1 * x_seq)
        return(list(limits, pred))
    } else {
        # Modelo nulo.
        pred <- data.frame(x = x_seq,
                           y = beta_0)
        limits <- data.frame(y_opt = beta_0,
                             x_opt = NA,
                             y_tol = beta_0 - tol,
                             x_tol_inf = NA,
                             x_tol_sup = NA)
        return(list(limits, pred))
    }
}

# Amplitude das variáveis preditoras.
tb_range <- tb_long %>%
    drop_na() %>%
    group_by(variable, cam) %>%
    summarise(x_range = list(range(valor)))

# O modelo para cada camada com prioridade secon > first > null.
tb_model <- tb_result %>%
    filter(pvalue < 0.05 | is.na(pvalue)) %>%
    group_by(variable, cam) %>%
    slice(n()) %>%
    ungroup()
# xtabs(~variable + cam, data = tb_model)

# Junta com a informação de amplitude das variáveis.
tb_limits <- inner_join(tb_model, tb_range)
## Joining, by = c("variable", "cam")# Obtém os limites e a tabela de valores preditos.
tb_limits <- tb_limits %>%
mutate(limits = pmap(list(beta_0,
beta_1,
beta_2,
tol = tol,
x_range = x_range),
quantile_limits))
tb_limits## # A tibble: 63 x 9
## variable cam model beta_0 beta_1 beta_2 pvalue x_range limits
## <chr> <fct> <fct> <dbl> <dbl> <dbl> <dbl> <list> <list>
## 1 acc [0, … null 125. NA NA NA <dbl [… <list…
## 2 acc [5, … null 125. NA NA NA <dbl [… <list…
## 3 acc [40,… null 125. NA NA NA <dbl [… <list…
## 4 al [0, … null 125. NA NA NA <dbl [… <list…
## 5 al [5, … first 137. -106. NA 0.00189 <dbl [… <list…
## 6 al [40,… first 137. -66.2 NA 0.0293 <dbl [… <list…
## 7 alp [0, … null 131. NA NA NA <dbl [… <list…
## 8 alp [5, … first 120. -28.6 NA 0.00153 <dbl [… <list…
## 9 alp [40,… null 125. NA NA NA <dbl [… <list…
## 10 are [0, … null 125. NA NA NA <dbl [… <list…
## # … with 53 more rows# Variávies para traçar as linhas de orientação.
tb_lines <- tb_limits %>%
select(variable, cam, limits) %>%
mutate(limits = map(limits, `[[`, 1)) %>%
unnest(limits)
# xtabs(~variable + cam, data = tb_lines)
# Valores preditos de acordo com os modelos escolhidos.
tb_pred <- tb_limits %>%
select(variable, cam, limits) %>%
mutate(limits = map(limits, `[[`, 2)) %>%
unnest(limits)
# xtabs(~variable + cam, data = tb_pred)# Gráfico.
ggplot(data = tb_long,
mapping = aes(x = valor, y = prod, color = cam)) +
facet_wrap(facets = ~variable, scales = "free_x", ncol = 3) +
geom_point(shape = 1) +
# ylim(extendrange(teca_arv$prod)) +
labs(color = "Camada") +
xlab("Valor da variável de solo") +
ylab("Produção de teca") +
# geom_quantile(quantiles = 0.9,
# formula = y ~ poly(x, degree = 2),
# linetype = 2) +
geom_line(data = tb_pred,
mapping = aes(x = x, y = y, color = cam),
size = 1.25) +
# geom_hline(data = tb_lines,
# mapping = aes(yintercept = y_opt, color = cam),
# linetype = 2) +
# geom_hline(data = tb_lines,
# mapping = aes(yintercept = y_tol, color = cam),
# linetype = 3) +
geom_vline(data = tb_lines,
mapping = aes(xintercept = x_opt, color = cam)) +
geom_vline(data = tb_lines,
mapping = aes(xintercept = x_tol_inf, color = cam),
linetype = 4) +
geom_vline(data = tb_lines,
mapping = aes(xintercept = x_tol_sup, color = cam),
linetype = 4) +
theme()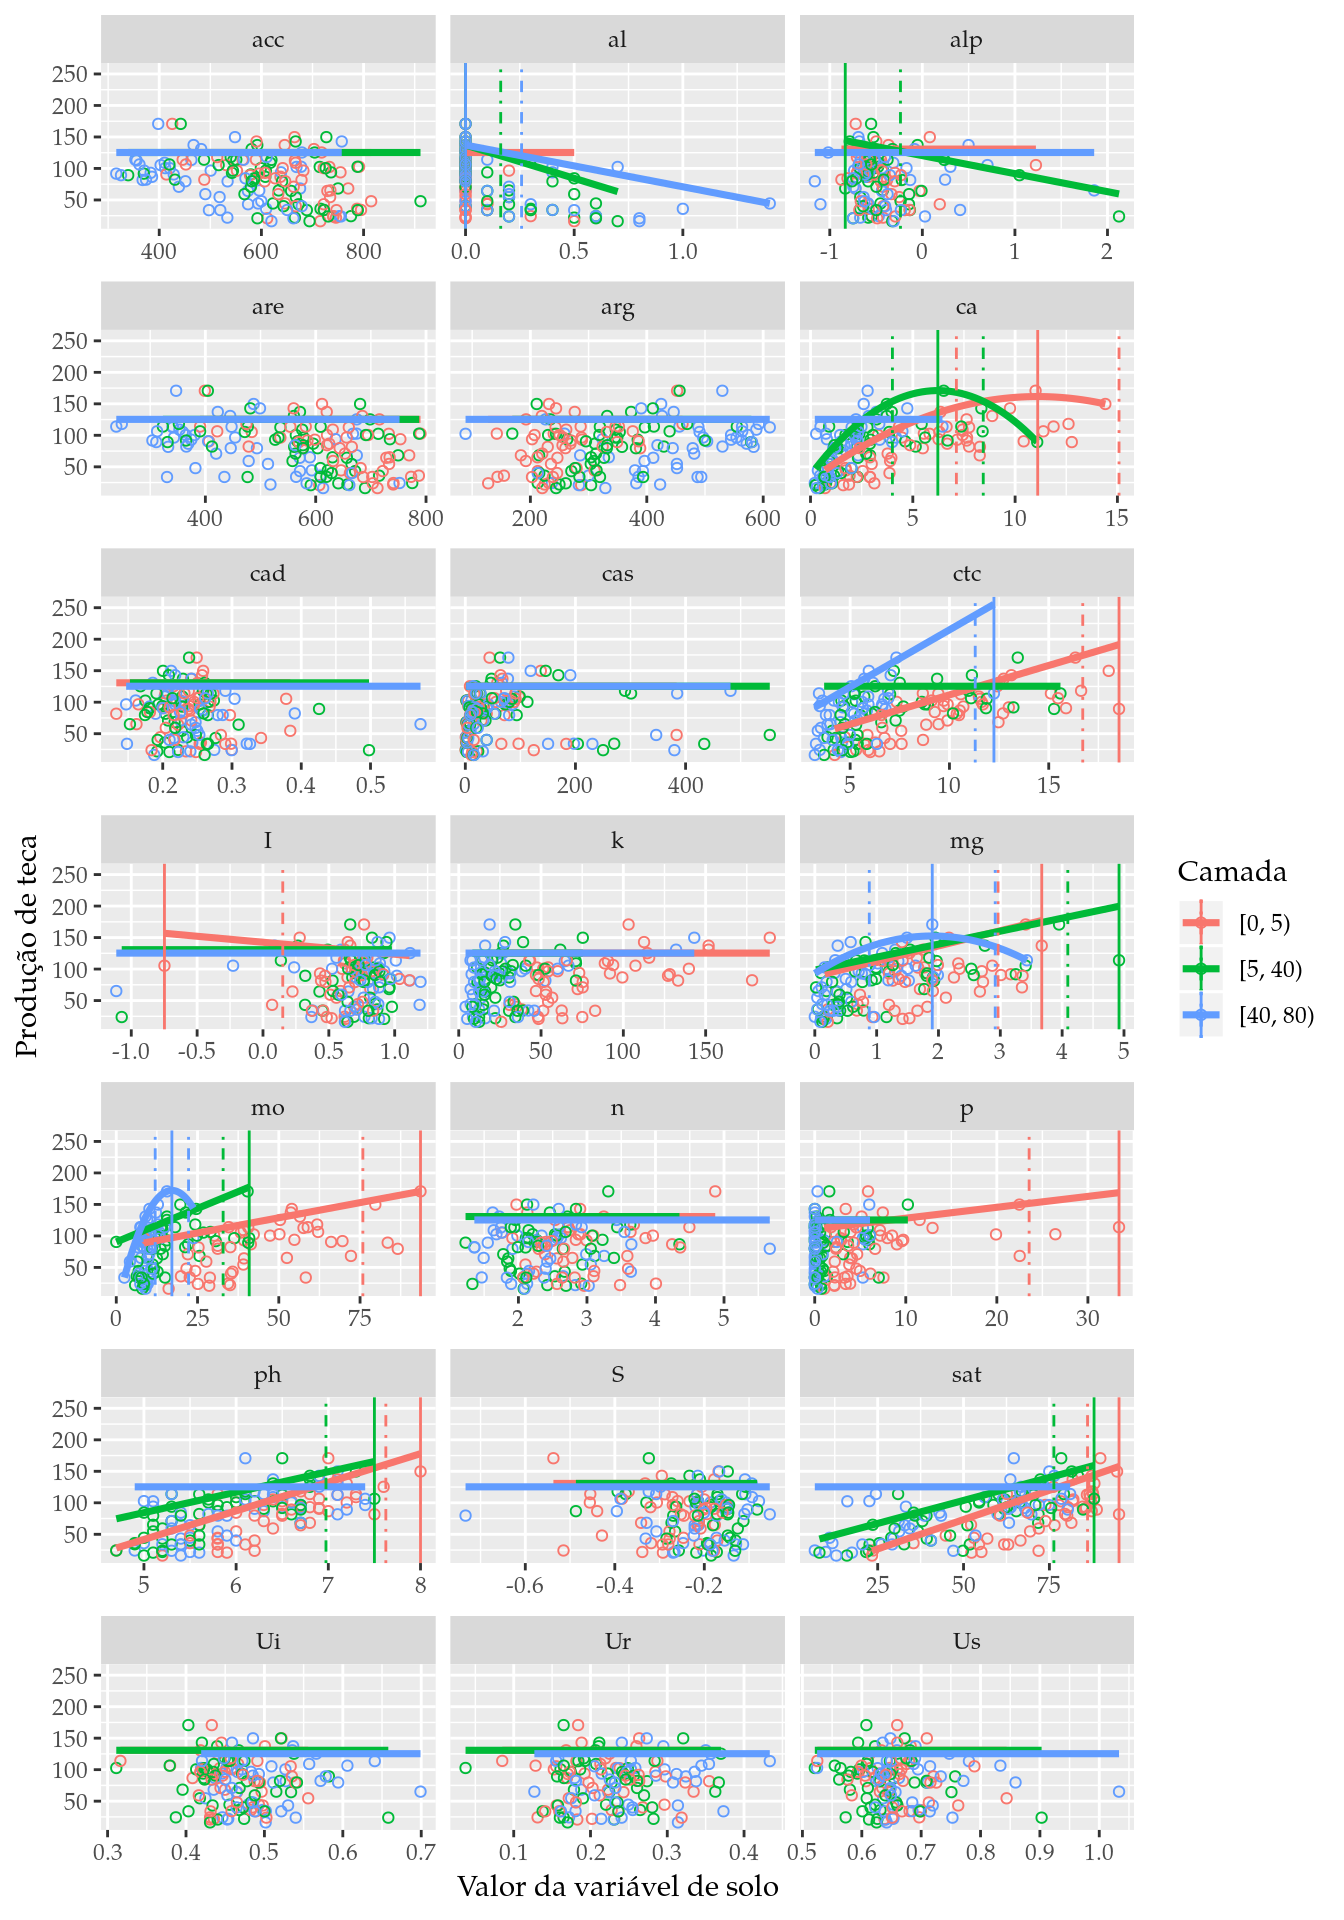
Informações da Sessão
## Atualizado em 11 de julho de 2019.
##
## R version 3.6.1 (2019-07-05)
## Platform: x86_64-pc-linux-gnu (64-bit)
## Running under: Ubuntu 18.04.2 LTS
##
## Matrix products: default
## BLAS:   /usr/lib/x86_64-linux-gnu/blas/libblas.so.3.7.1
## LAPACK: /usr/lib/x86_64-linux-gnu/lapack/liblapack.so.3.7.1
##
## locale:
##  [1] LC_CTYPE=pt_BR.UTF-8       LC_NUMERIC=C
##  [3] LC_TIME=pt_BR.UTF-8        LC_COLLATE=en_US.UTF-8
##  [5] LC_MONETARY=pt_BR.UTF-8    LC_MESSAGES=en_US.UTF-8
##  [7] LC_PAPER=pt_BR.UTF-8       LC_NAME=C
##  [9] LC_ADDRESS=C               LC_TELEPHONE=C
## [11] LC_MEASUREMENT=pt_BR.UTF-8 LC_IDENTIFICATION=C
##
## attached base packages:
## [1] stats     graphics  grDevices utils     datasets  methods
## [7] base
##
## other attached packages:
##  [1] forcats_0.4.0       stringr_1.4.0       dplyr_0.8.3
##  [4] purrr_0.3.2         readr_1.3.1         tidyr_0.8.3
##  [7] tibble_2.1.3        ggplot2_3.2.0       tidyverse_1.2.1
## [10] quantreg_5.41       SparseM_1.77        EACS_0.0-7
## [13] wzRfun_0.91         captioner_2.2.3     latticeExtra_0.6-28
## [16] RColorBrewer_1.1-2  lattice_0.20-38     knitr_1.23
##
## loaded via a namespace (and not attached):
##  [1] httr_1.4.0         pkgload_1.0.2      jsonlite_1.6
##  [4] modelr_0.1.4       assertthat_0.2.1   highr_0.8
##  [7] cellranger_1.1.0   yaml_2.2.0         remotes_2.1.0
## [10] sessioninfo_1.1.1  pillar_1.4.2       backports_1.1.4
## [13] glue_1.3.1         digest_0.6.20      rvest_0.3.4
## [16] colorspace_1.4-1   htmltools_0.3.6    Matrix_1.2-17
## [19] pkgconfig_2.0.2    devtools_2.1.0     broom_0.5.2
## [22] haven_2.1.1        scales_1.0.0       processx_3.4.0
## [25] MatrixModels_0.4-1 generics_0.0.2     usethis_1.5.1
## [28] withr_2.1.2        lazyeval_0.2.2     cli_1.1.0
## [31] readxl_1.3.1       magrittr_1.5       crayon_1.3.4
## [34] memoise_1.1.0      evaluate_0.14      ps_1.3.0
## [37] fansi_0.4.0        fs_1.3.1           nlme_3.1-140
## [40] MASS_7.3-51.4      xml2_1.2.0         pkgbuild_1.0.3
## [43] tools_3.6.1        prettyunits_1.0.2  hms_0.5.0
## [46] munsell_0.5.0      callr_3.3.0        compiler_3.6.1
## [49] pkgdown_1.3.0      rlang_0.4.0        grid_3.6.1
## [52] rstudioapi_0.10    labeling_0.3       rmarkdown_1.13
## [55] testthat_2.1.1     gtable_0.3.0       roxygen2_6.1.1
## [58] R6_2.4.0           lubridate_1.7.4    utf8_1.1.4
## [61] zeallot_0.1.0      commonmark_1.7     rprojroot_1.3-2
## [64] desc_1.2.0         stringi_1.4.3      Rcpp_1.0.1
## [67] vctrs_0.2.0        tidyselect_0.2.5   xfun_0.8